Overview
Reports offer three distinct widget types for customizing your analysis:
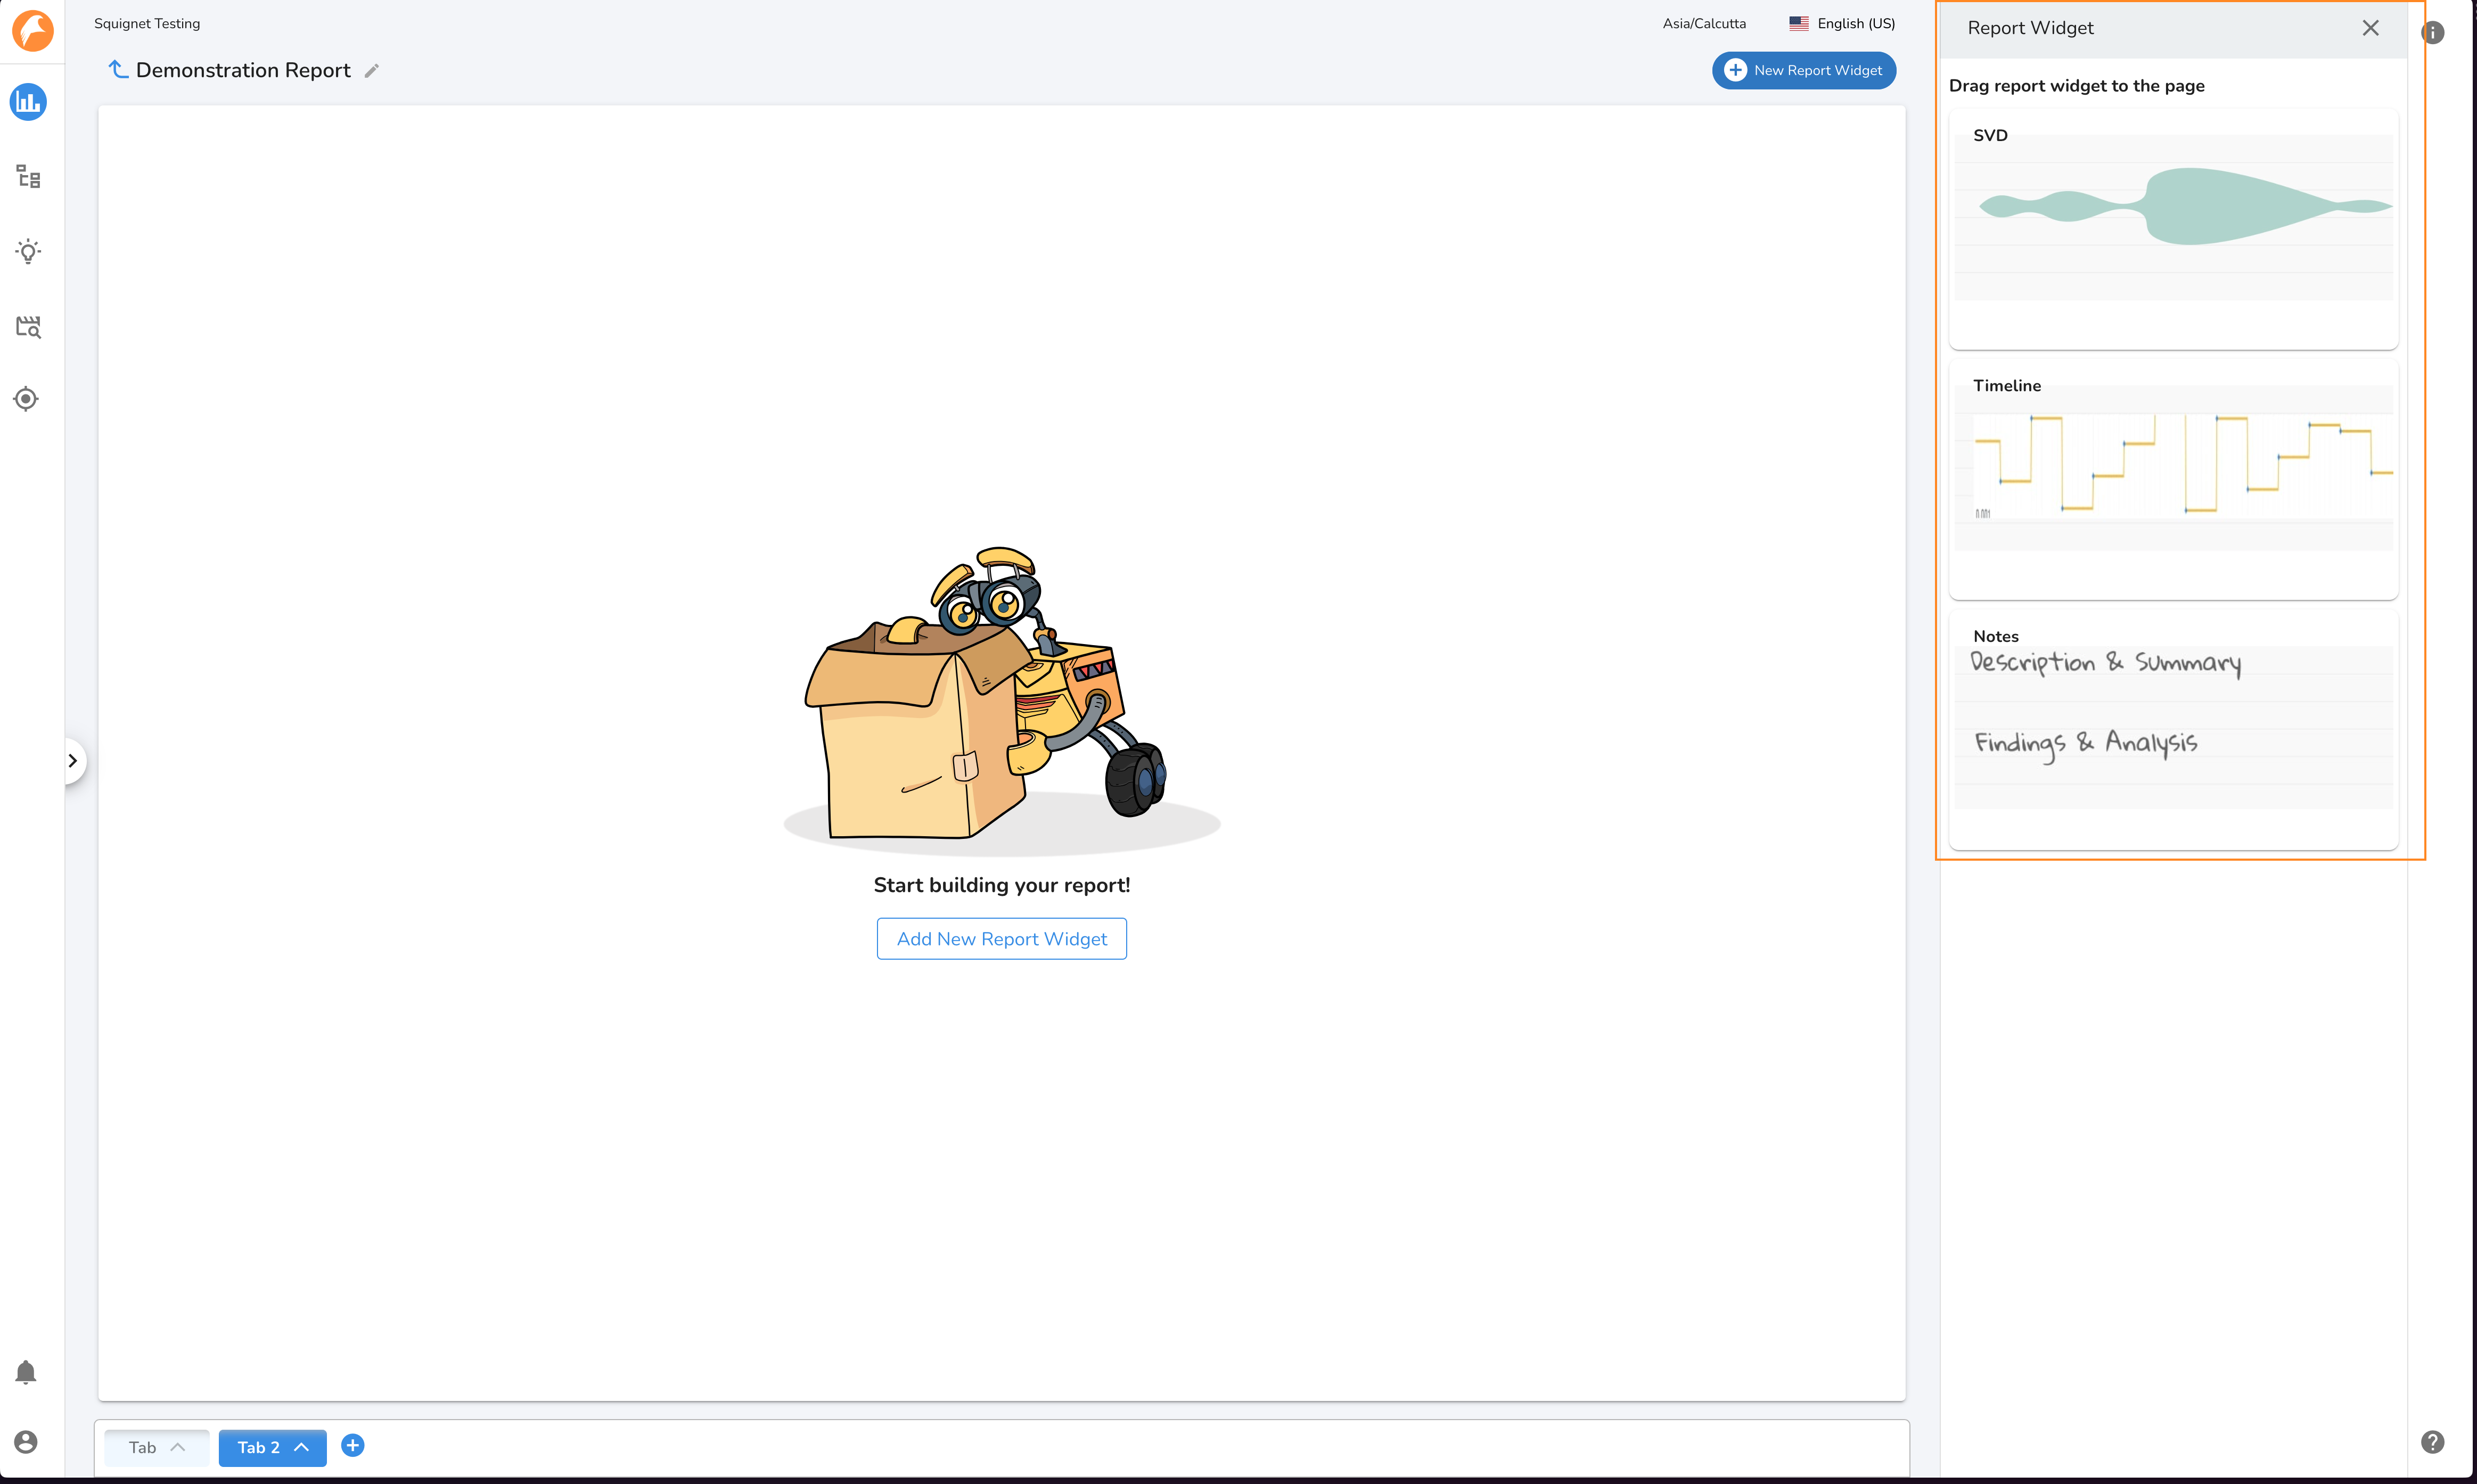
- Notes Widget: A rich-text editor that allows you to include written analysis, findings, tables, images, and even videos to support your documentation.
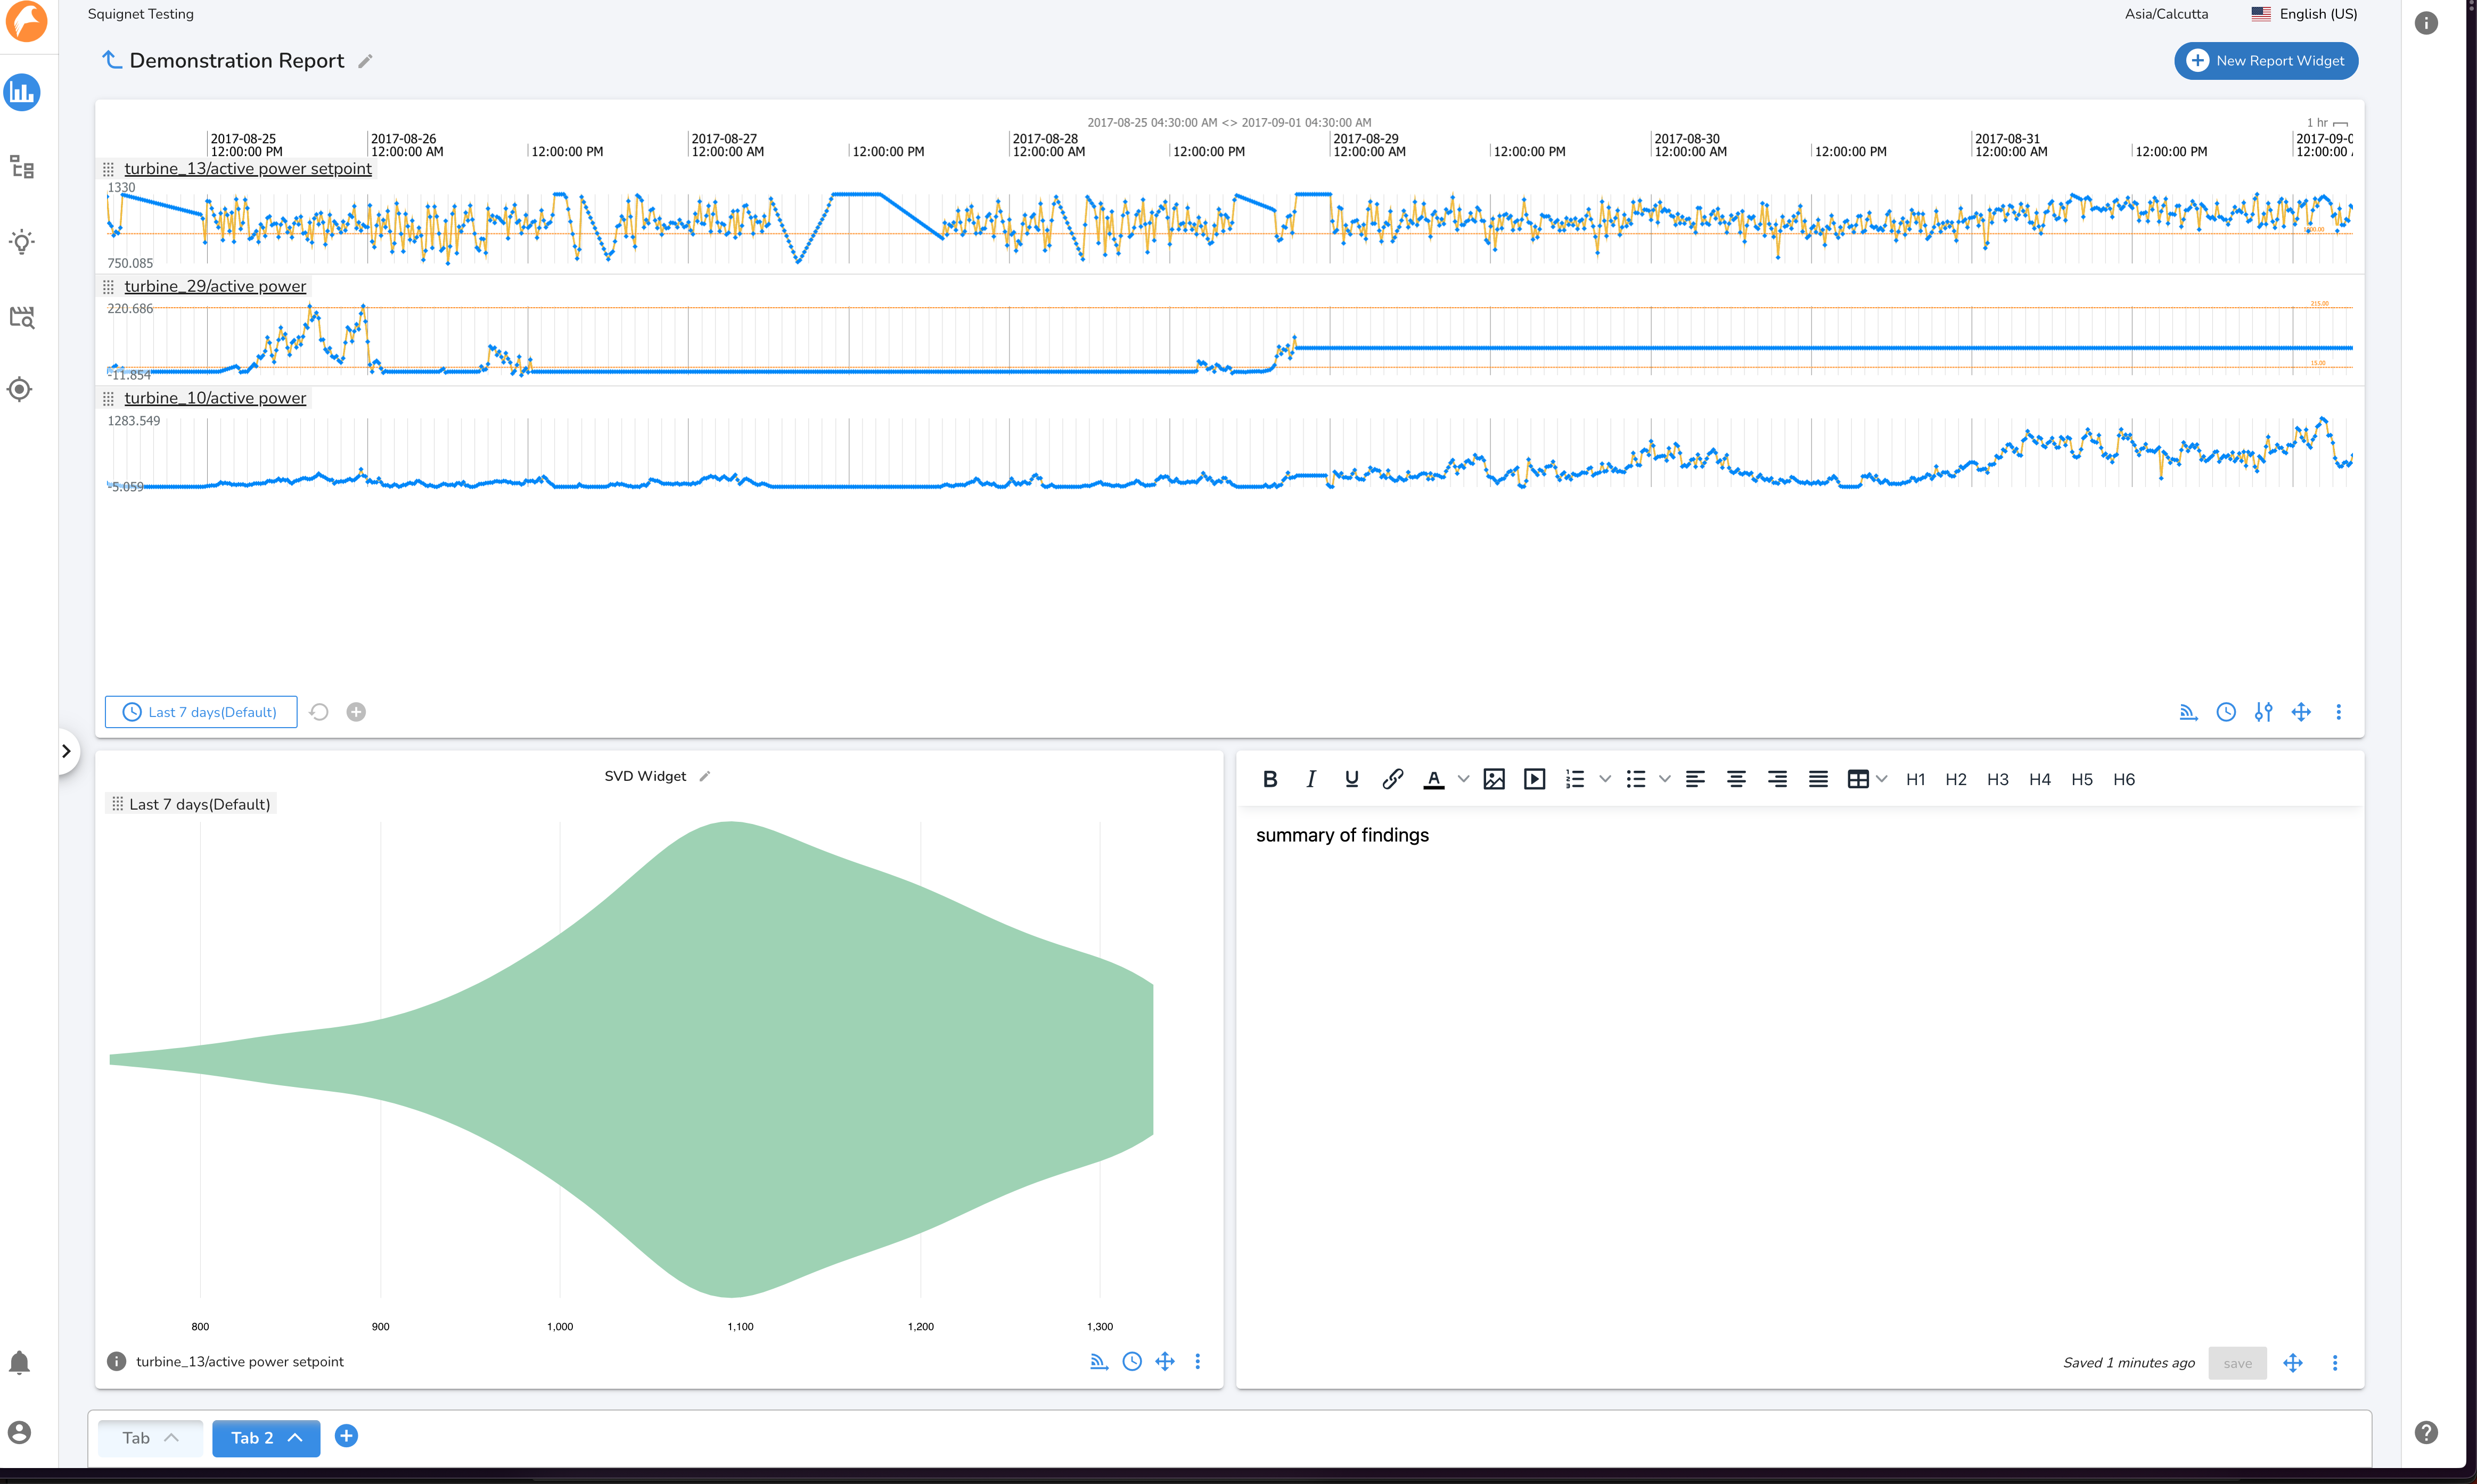
- Timeline Widget: Displays a "wall of data" showing multiple signals over a specified time range. It provides an aggregated view of raw signal data and can include both reference signals and signals associated with a selected tree node.
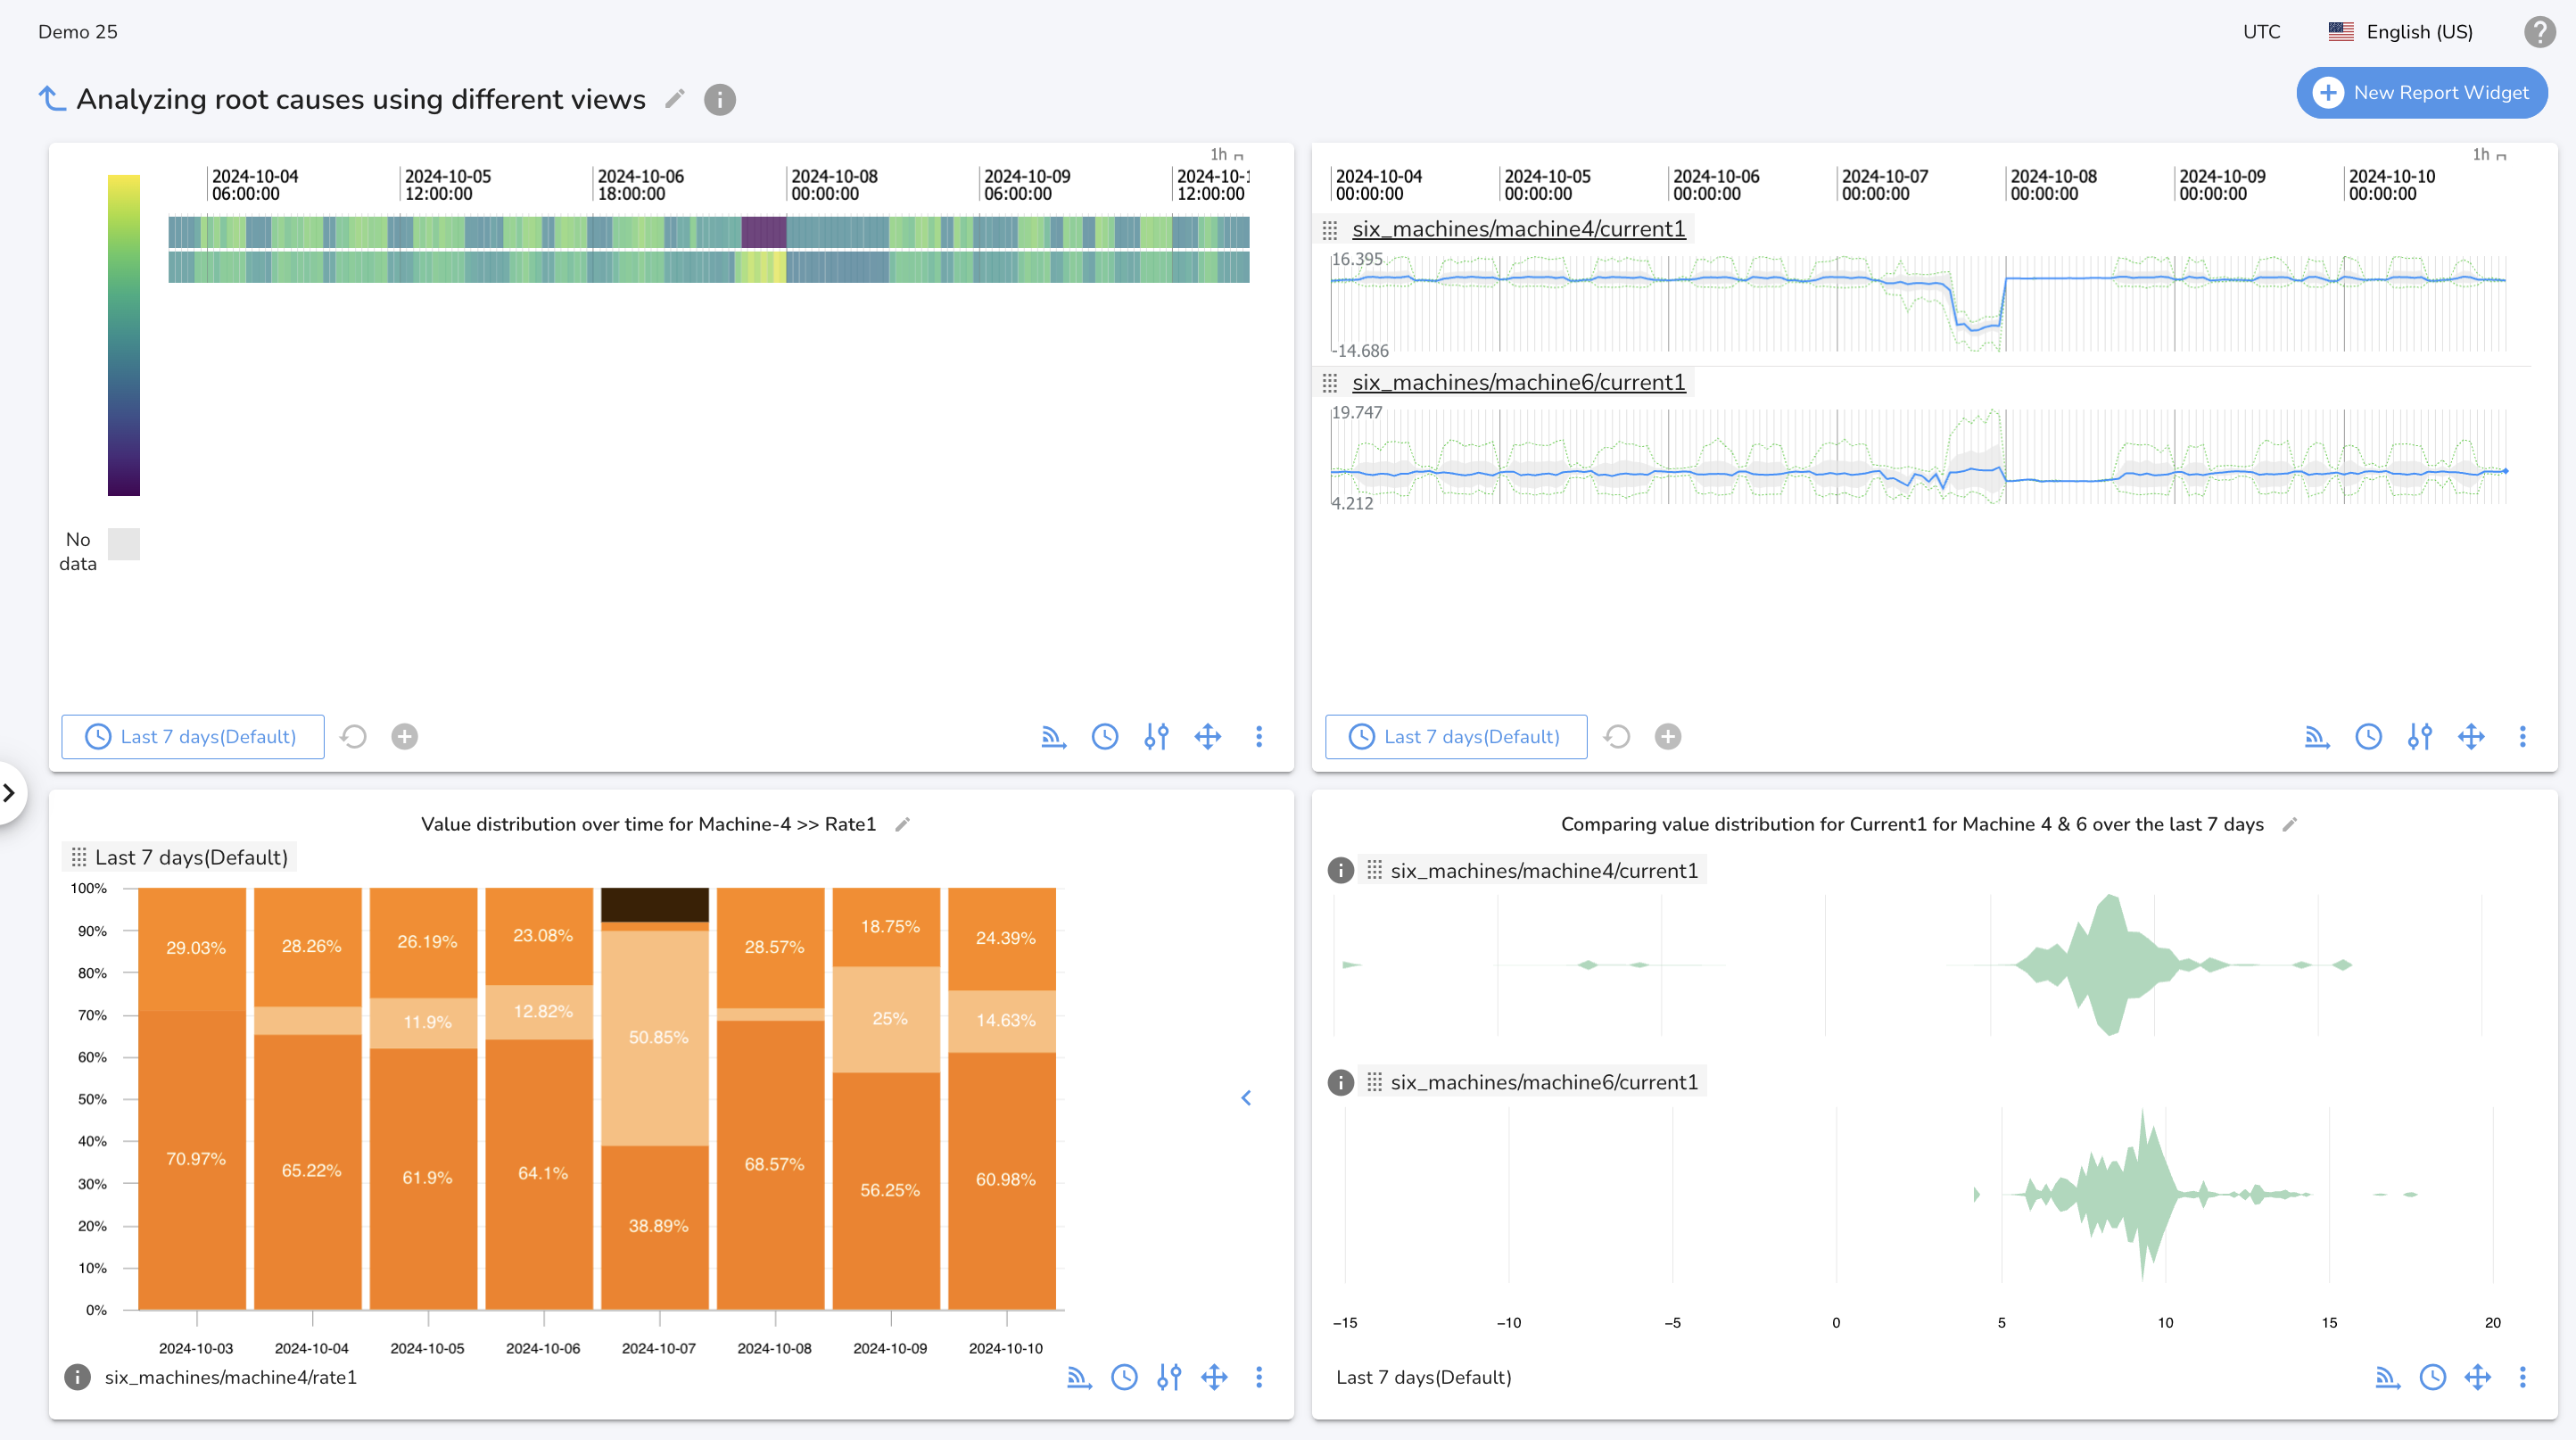
- Signal Value Distribution (SVD) Widget: A powerful tool to visualize the distribution of signal values over one or more time ranges. It is particularly useful for comparing signal behavior across different signals or time periods.
Organizing Widgets
Adding Report Widgets
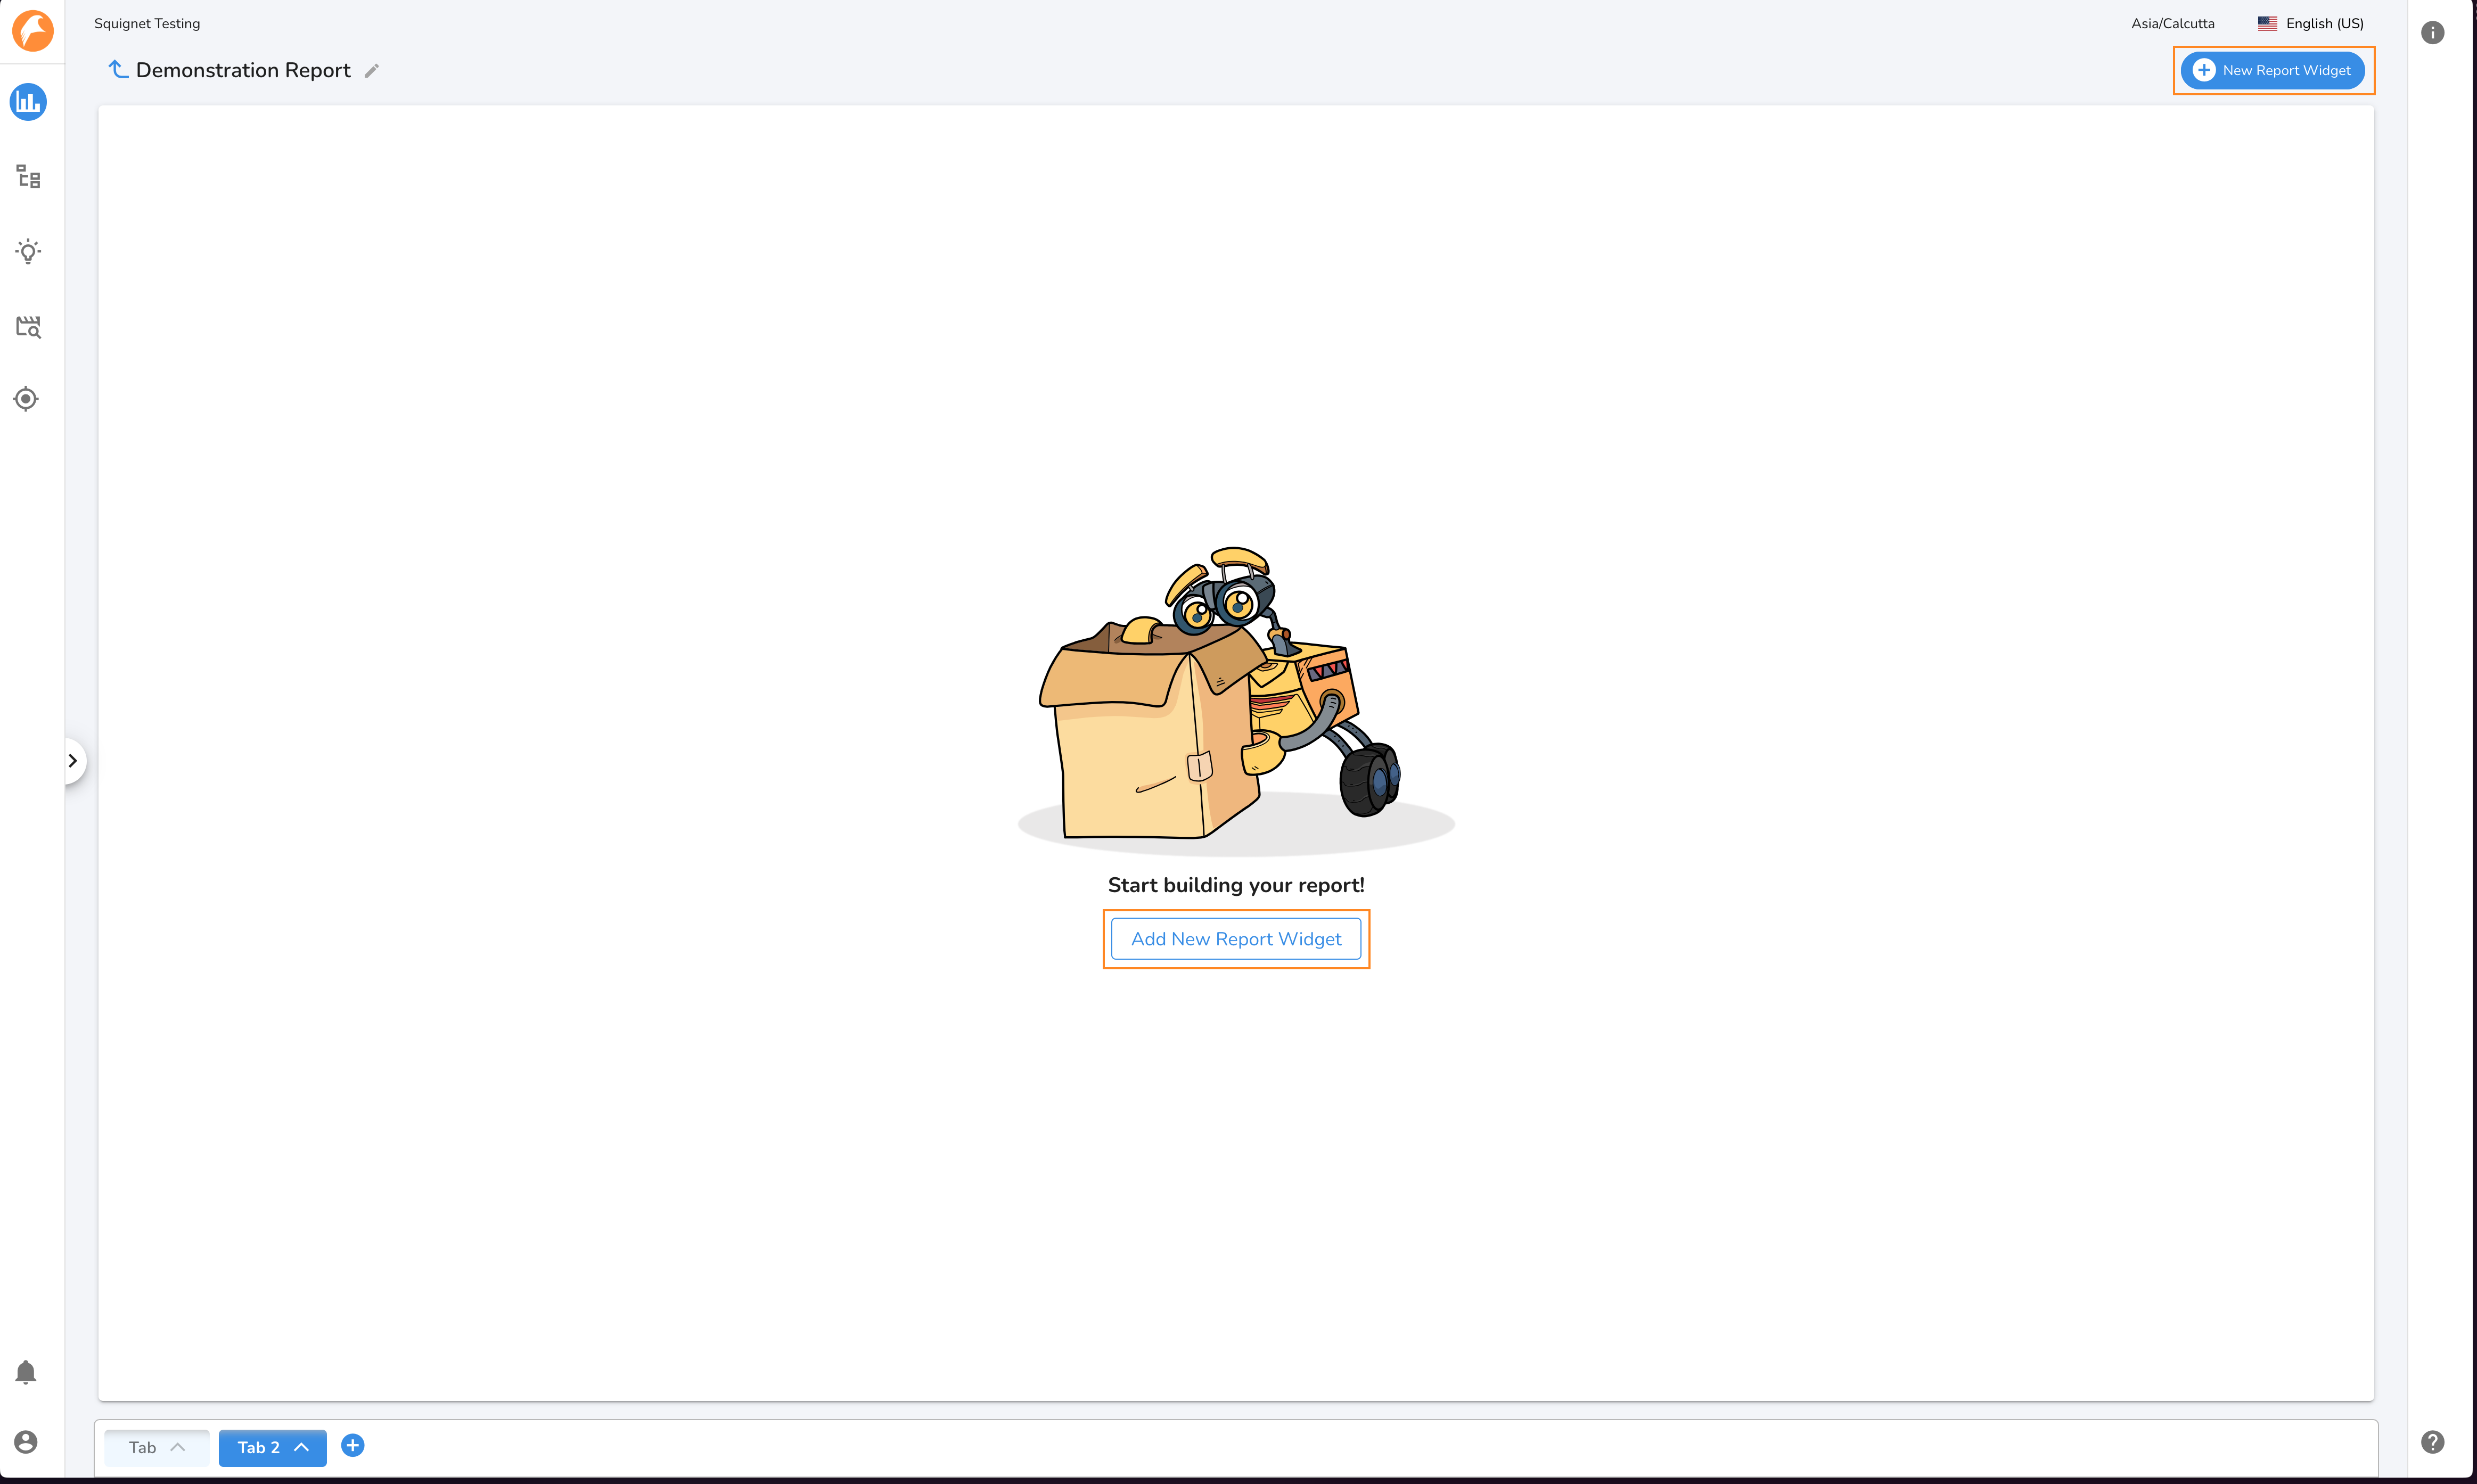
Click the "Add New Report Widget" button the middle of an empty tab (or in the upper right corner if the tab is empty)
Drag the desired widget from the Widget Menu into the main tab area. The space the new widget will occupy is highlighted with a blue box. This is based on your mouse position and the current arrangement of widgets on a tab.
Widget Layouts
You may place up to 4 widgets on a single tab. A widget may occupy:
- 100% of the tab for 1 widget.
- 50% of the tab for 2 widgets. The tab may be split vertically or horizontally.
- 25% of the tab for 3 or 4 widgets.
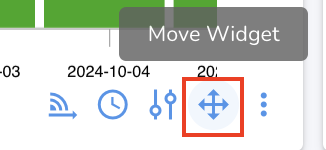
Repositioning Widgets
Widgets can be moved by clicking and dragging their "Move Widget" icon. Other widgets on the tab will automatically move and resize to make space for the widget being repositioned.
Note
The reposition icon will not appear when only one widget is on a tab.
Deleting Widgets:
Open the kebab menu on the Widget Control Bar and select "Delete widget"
