Timeline Widget
The Timeline Widget provides a "wall of data" view, displaying multiple signals over a specified time range. It's designed for an aggregated view of raw signal data and allows for detailed visual exploration.
This widget is ideal for displaying a time-series chart of your signals. It can show both reference signals (any signals from your account) and signals associated with a selected tree node. It's frequently used to show signal behavior before, during, and after an incident.
Creating a Timeline Widget
Similar to other widgets, you can add a Timeline Widget by clicking the "New Report Widget" button and dragging the "Timeline" widget to your report tab.
A timeline widget can be displayed in three ways:
- A line plot: Line plots are useful when absolute values of the signal are important to report against.
-
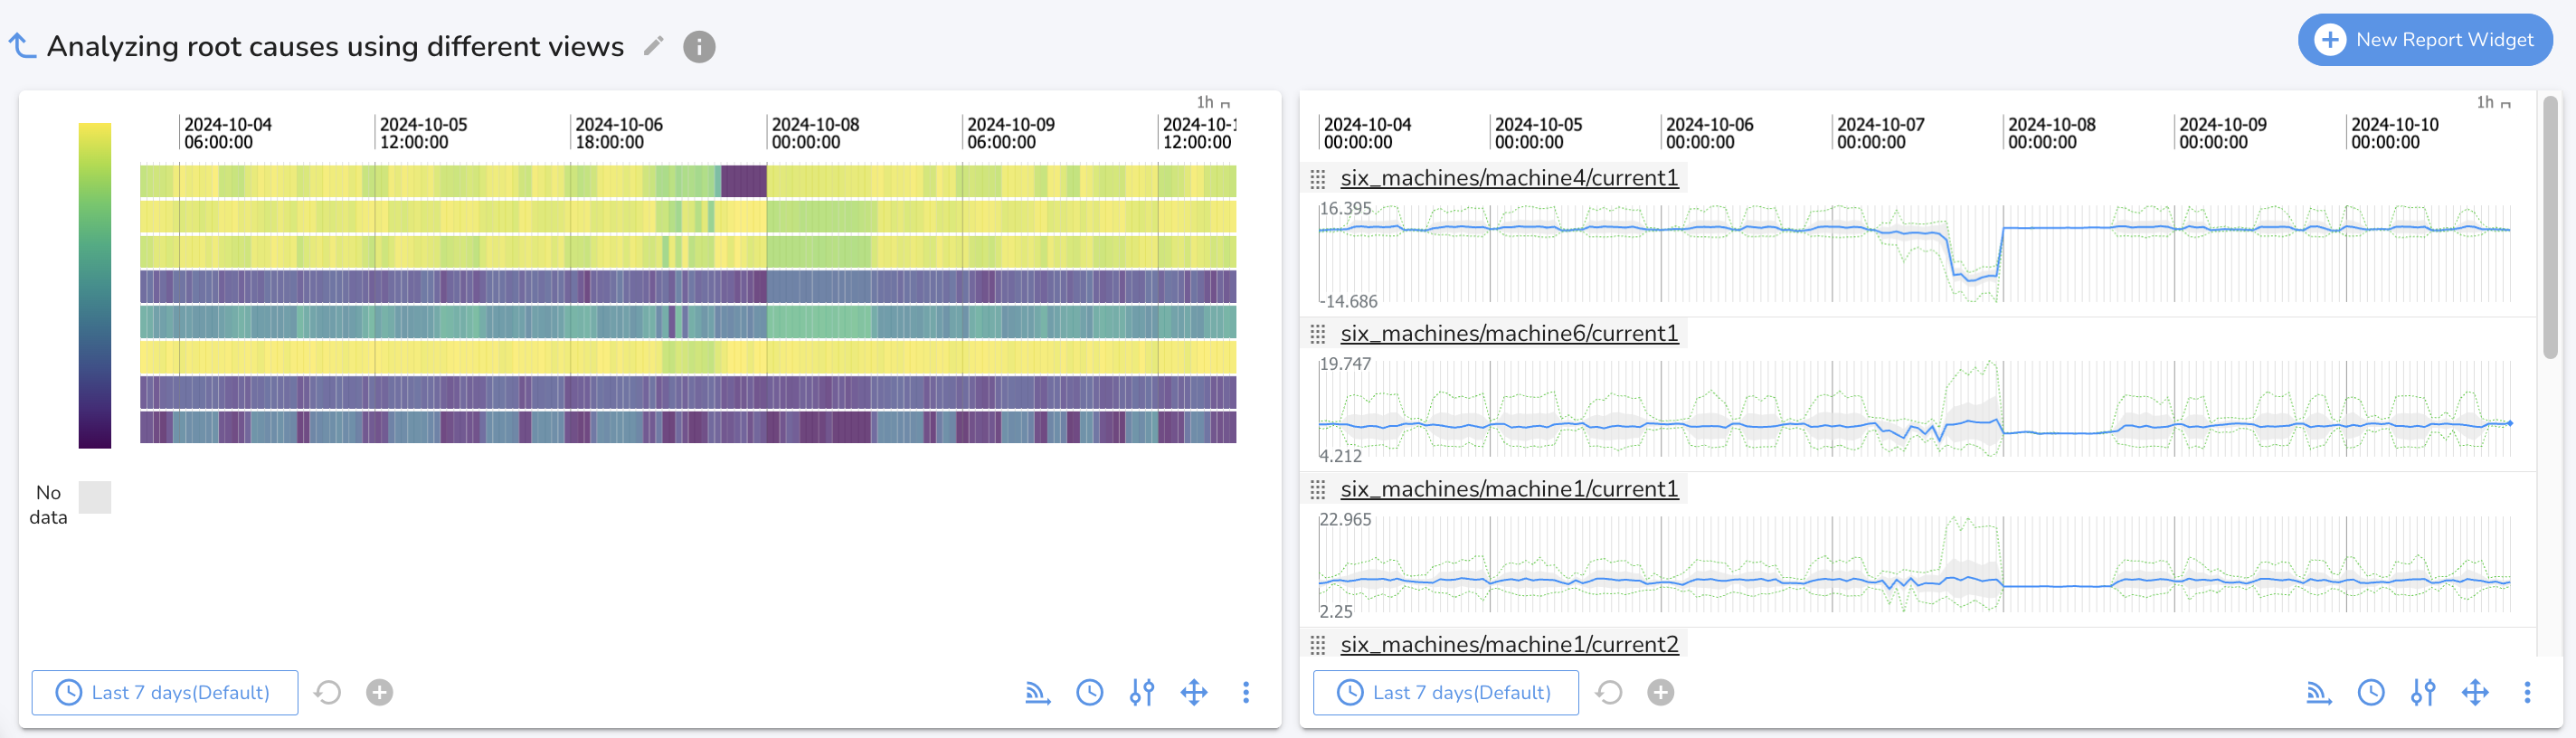
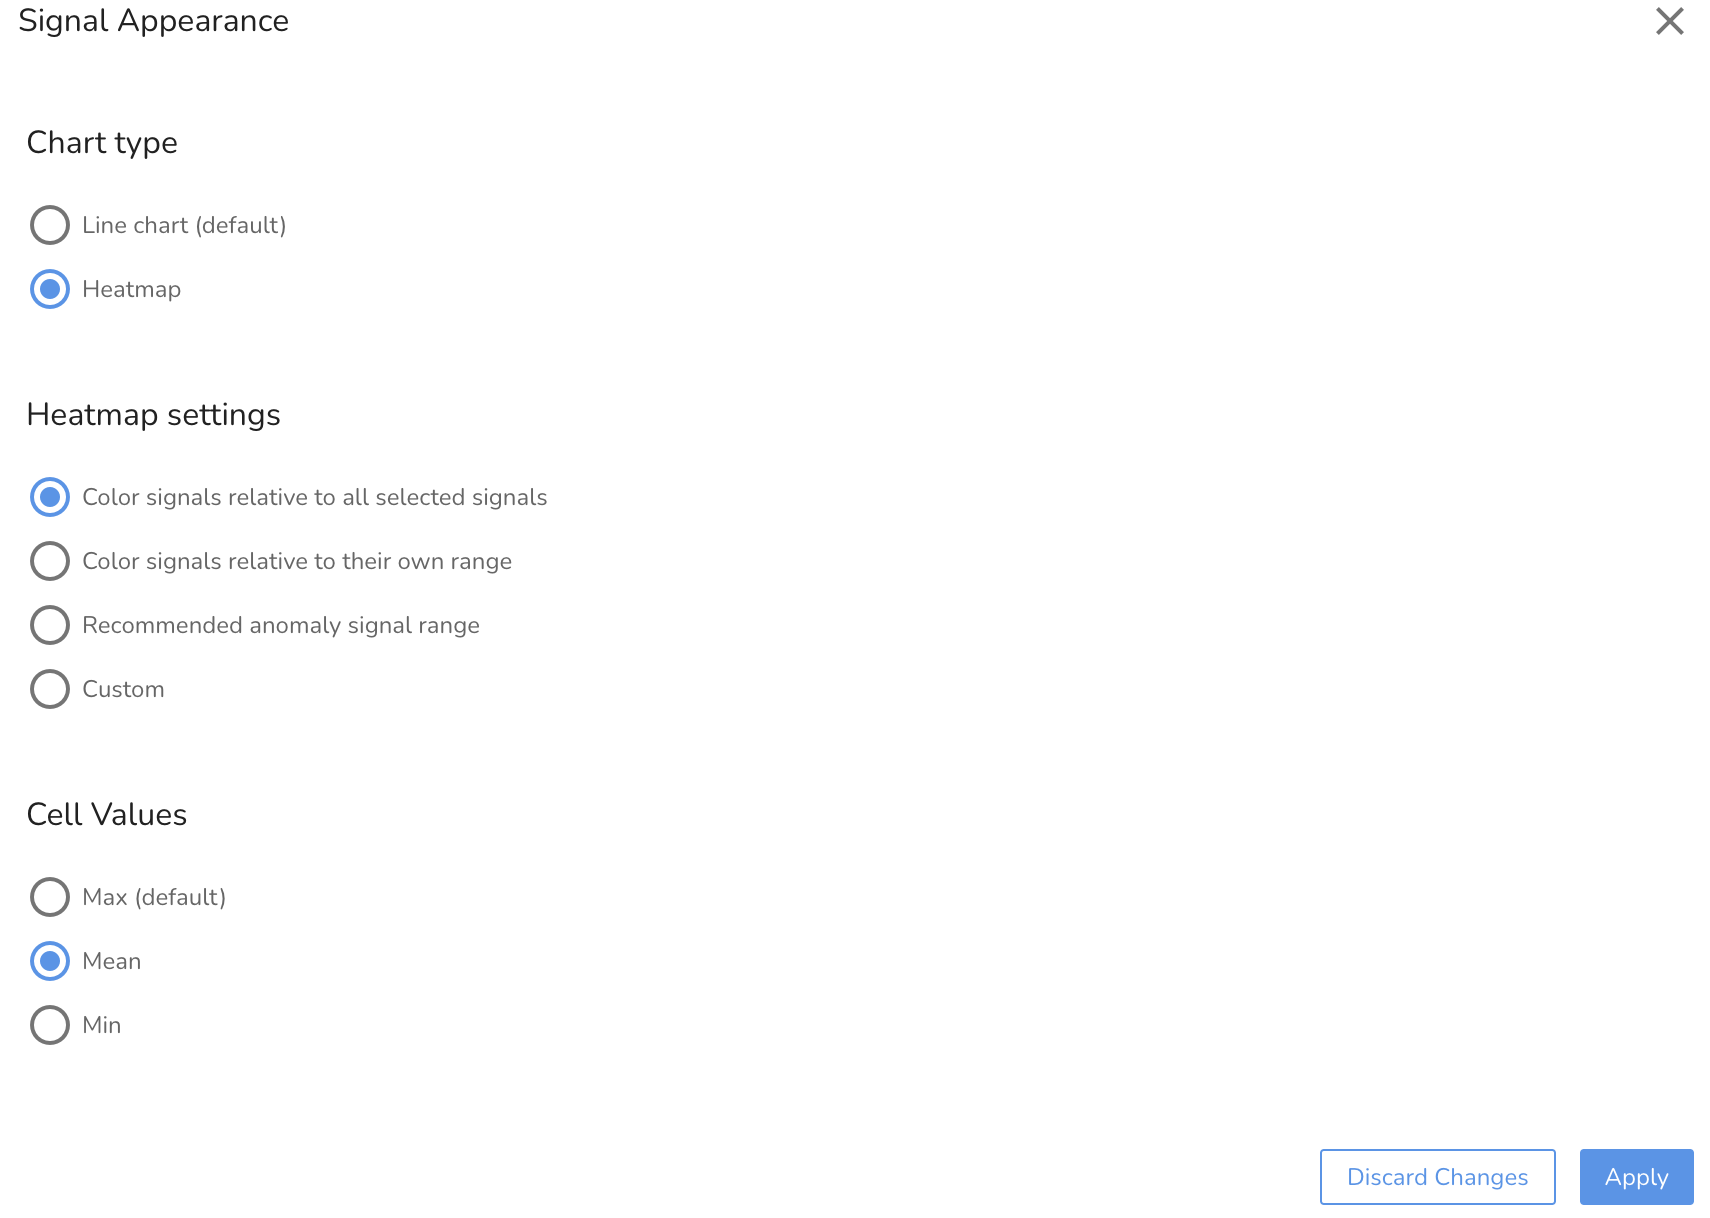
A heatmap: Heatmaps offer ready comparison across similar or different signals, with particular emphasis on value variances during the selected time range. Various options are availble when choosing a heatmap signal appearance and the user should determine the sensitivity of the heatmap to extremes as well as the comparability of signals included in the widget to make selections for signal appearanace.
To switch between the two views, click on the Signal Appearance icon on the widget toolbar.
-
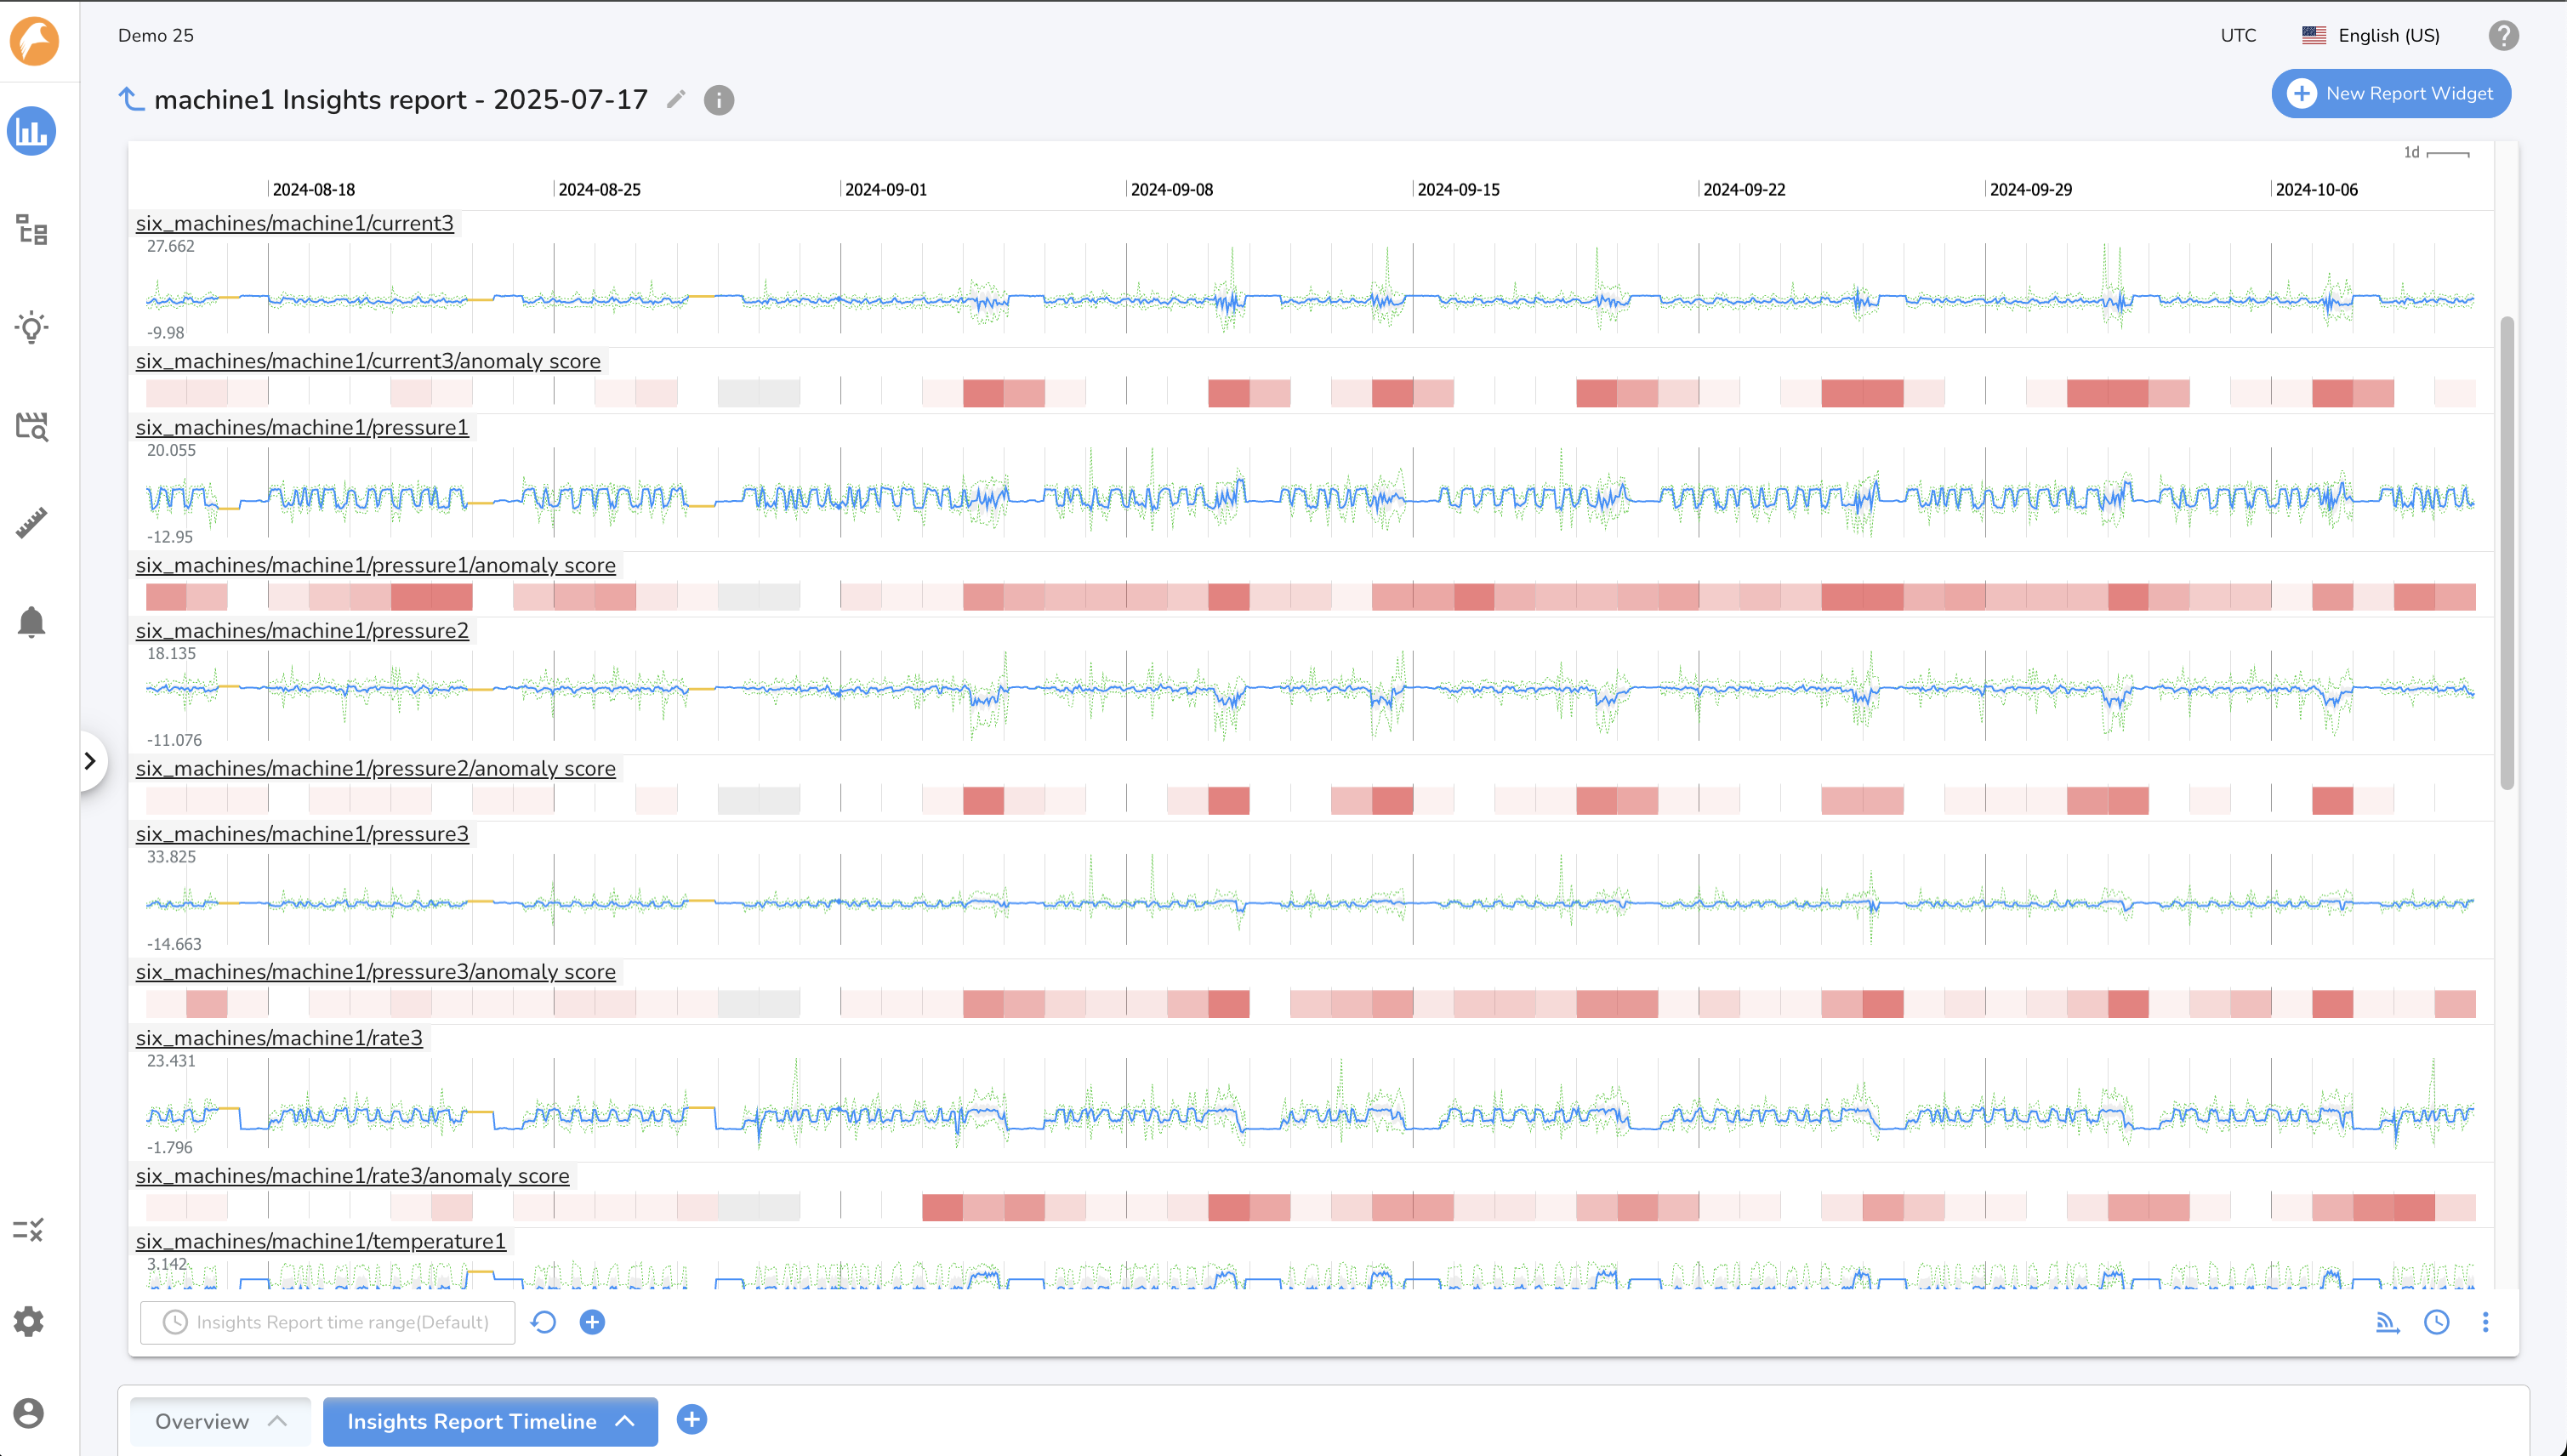
An anomaly heatmap alongside raw signals: An anomaly heatmap can be generated for signals that are organized into trees through the Insights Dashboard. This anomaly heatmap can then be displayed alongside the raw signal data on the Timeline view. Specifically, when you create an Insights Report, the "Insights Report Timeline tab" will feature a Timeline Widget for "Tree Signals" that presents these signals with the Insights Assessment overlayed. This overlay is the heatmap visualization of the anomaly scores. The heatmap uses a color gradient to represent the severity of deviation from expected behavior, with white indicating normal operations, a lighter to darker red gradient for varying degrees of deviations from expected behavior.
How to Set Up the anomaly heatmap display
To view your time series data as line plots with an anomaly heatmap alongside in a Timeline Widget, you would typically use the Insights reporting functionality:
- Generate an Insights Report: After reviewing anomalous behavior in the Insights Dashboard, you can click the "Explore" button to generate an Insights Report.
- Access the Report: This action automatically saves the Insights Report in the "Insights Reports Folder".
- View the Timeline tab: The generated report will include an "Insights Report Timeline tab" that contains a Timeline Widget designed to display your tree node signals with the anomaly heatmap alongside the signal.
- Adjust Settings: Within the Insights Dashboard (which informs the report's initial view), you can use the "Signal Appearance" button to change Y-axis and heatmap settings. These settings would influence how the overlay appears.