Rules Dashboard
When a Rule is live, use the Rule Dashboard to see the inputs and outputs signals in real time.
Output signals
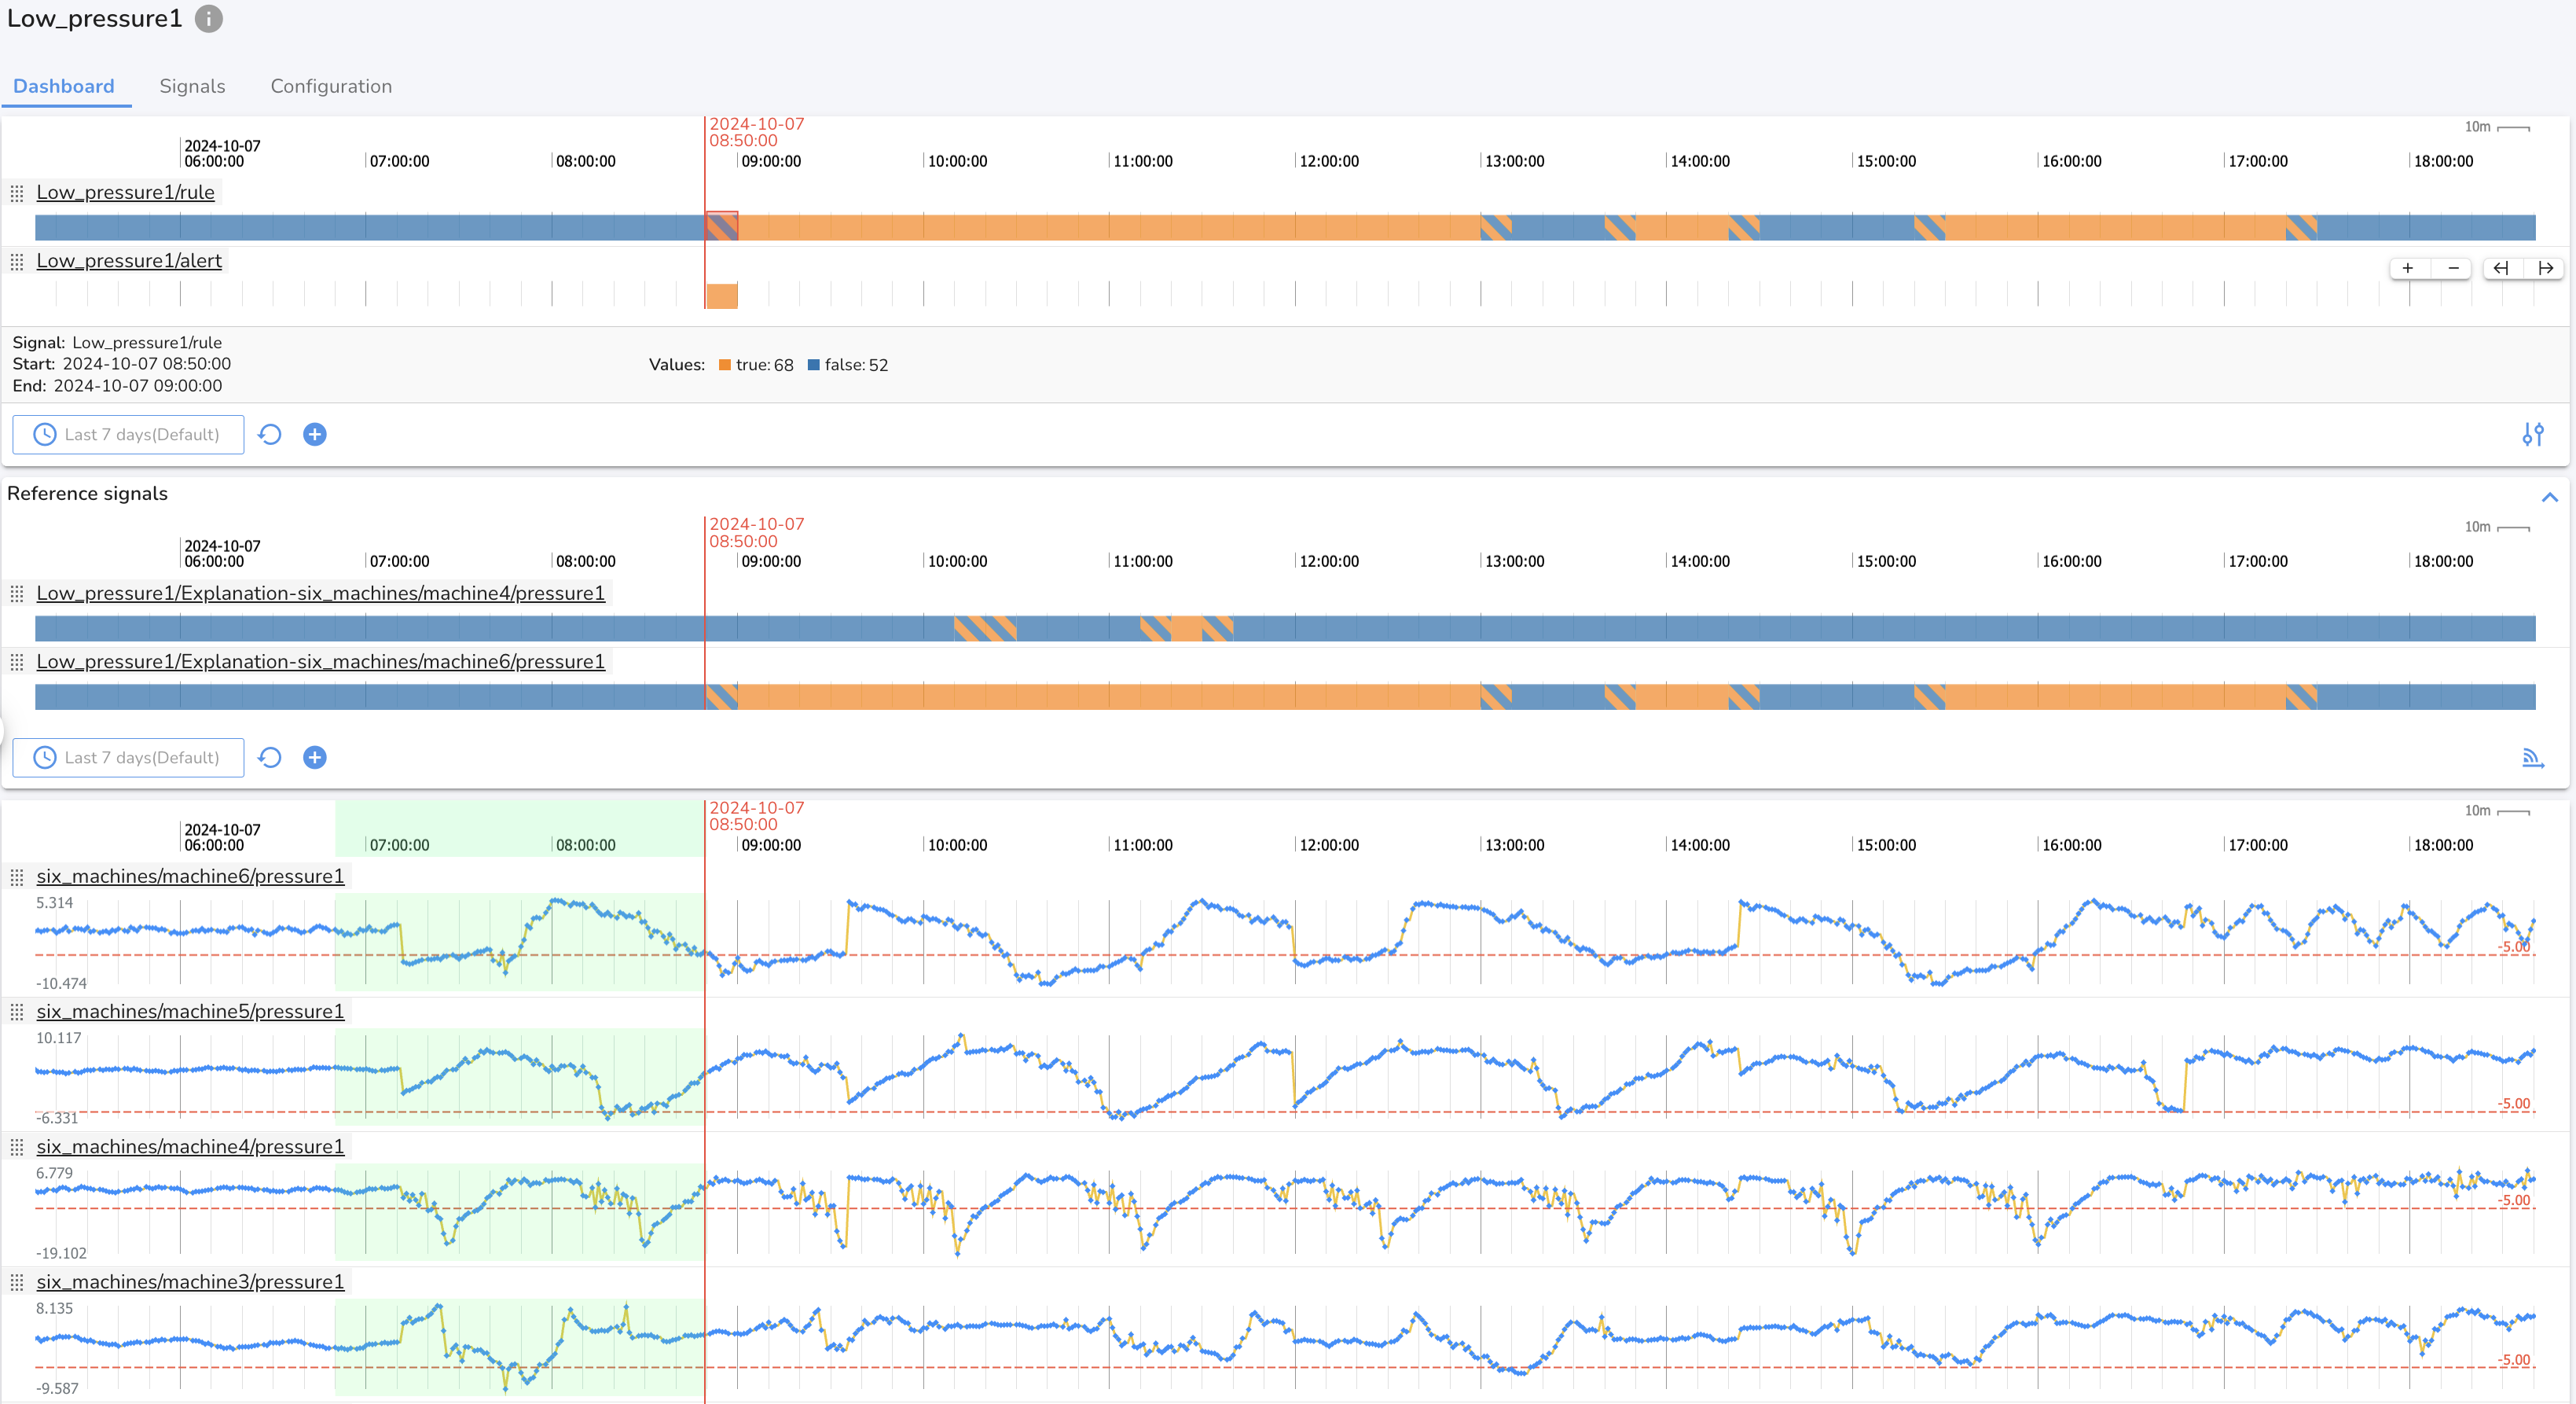
The first section of the Rule dashboard has charts containing the Rule (<rule name>/rule), Alert (<rule name> /alert), and Explanation (<rule name>/Explanation-<signal name>) output signals for the rule. The first lane contains these output signals.
Display Rule Evaluation Window
By clicking any where on the <rule name>/rule output signal chart, the system will highlight the portion of the input signals history that was used to generate the assessment output.
Reference Signals
Add up to 50 reference signals to this section to aid in rule interpretation.
Input Signals
This section of the Rule Dashboard contains charts for all of the input signals to the rule. For a numeric-signals based Rule, each chart displays a line representing the statistic selected in the rule condition, and a threshold line indicating the value of the rule condition. Use the Signal Appearance menu to switch the chart view to the standard 'All lines' view.
Time Ranges on the Rule Dashboard
The Rule dashboard sections all share a time range. Zooming, panning, or using the time range manager will update all three sections. If the time range for the rule dashboard is a relative time range (e.g. last 24 hours) the timeline charts on the Rule Dashboard will automatically update in real time as data is received and processed.